
One live source of truth for the whole fab
Analytics keeps planners and management on the same current numbers — and makes every recommendation and every change auditable.
Target figures are design targets from simulation on synthetic fab data. aPlanner has no customer deployments yet; first pilot results are expected in 2027.
What it is, what it solves, what it brings
What it is
Live planning KPIs (adherence, OTD, WIP, utilization), anomaly detection and explainable recommendations, with Korean / English planner and executive views and a full change history.
What problem it solves
Data is siloed in MES, ERP and spreadsheets; planners spend about 70% of their time gathering it; management sees yesterday’s numbers and asks "why?" by phone.
What benefit it brings
One always-current source of truth; target: planner time on strategy from 20% to 60%; every recommendation auditable; every commit logged with its reason, author and KPI delta.
From tool-group load to the audit trail
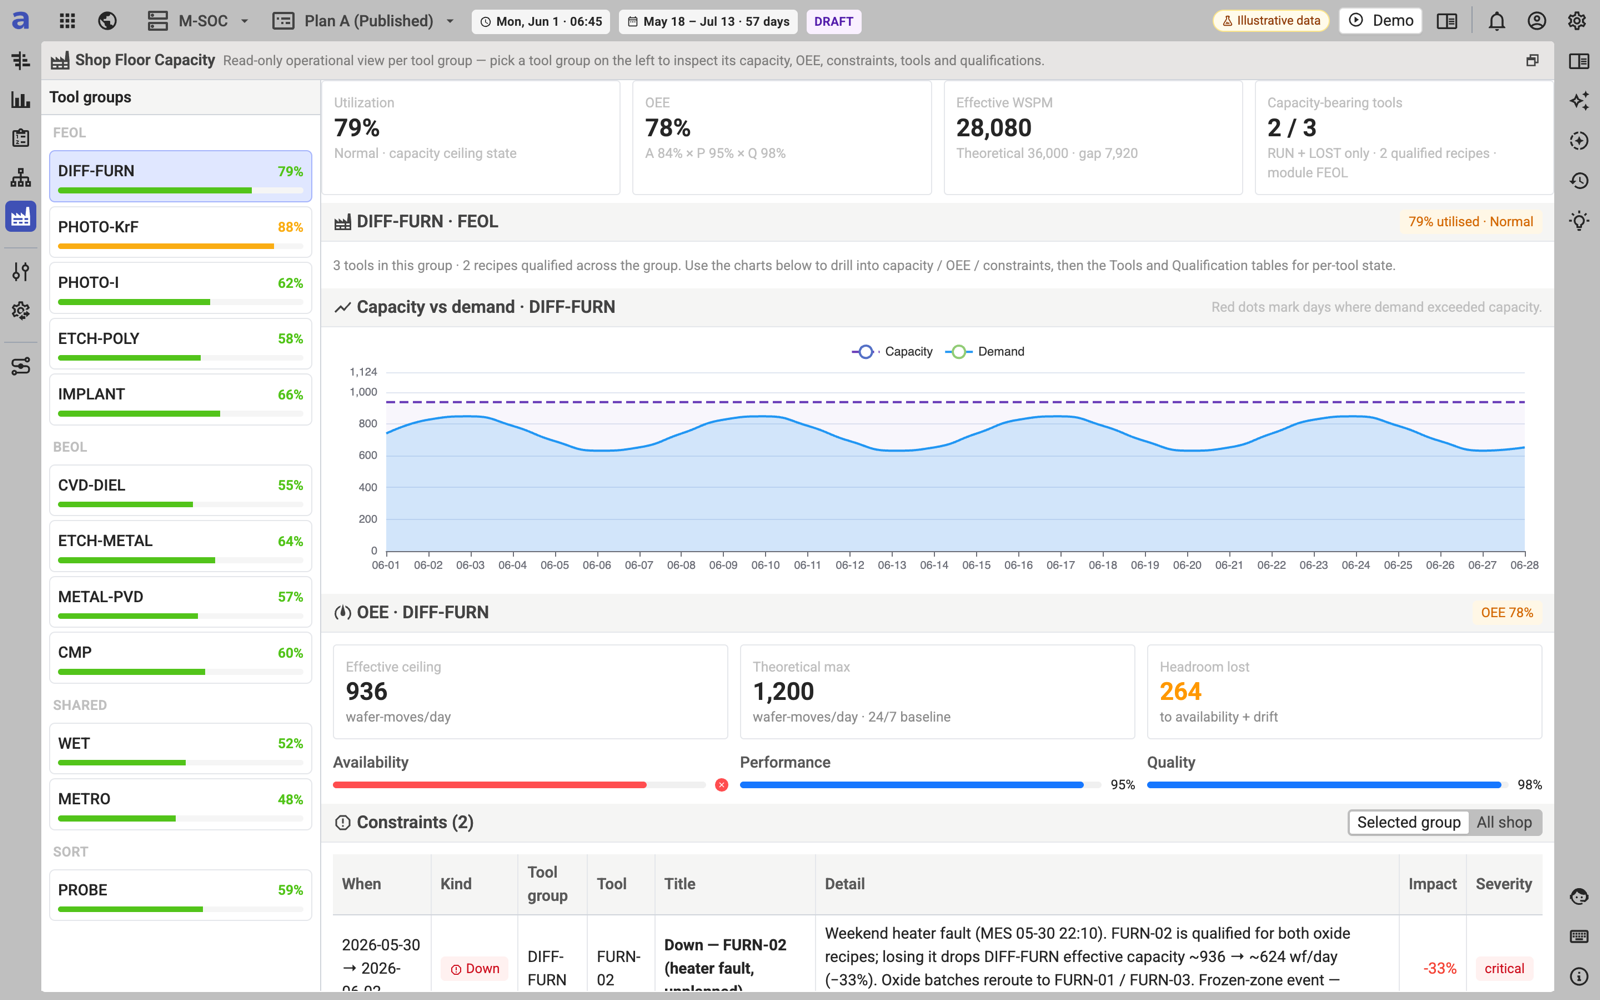
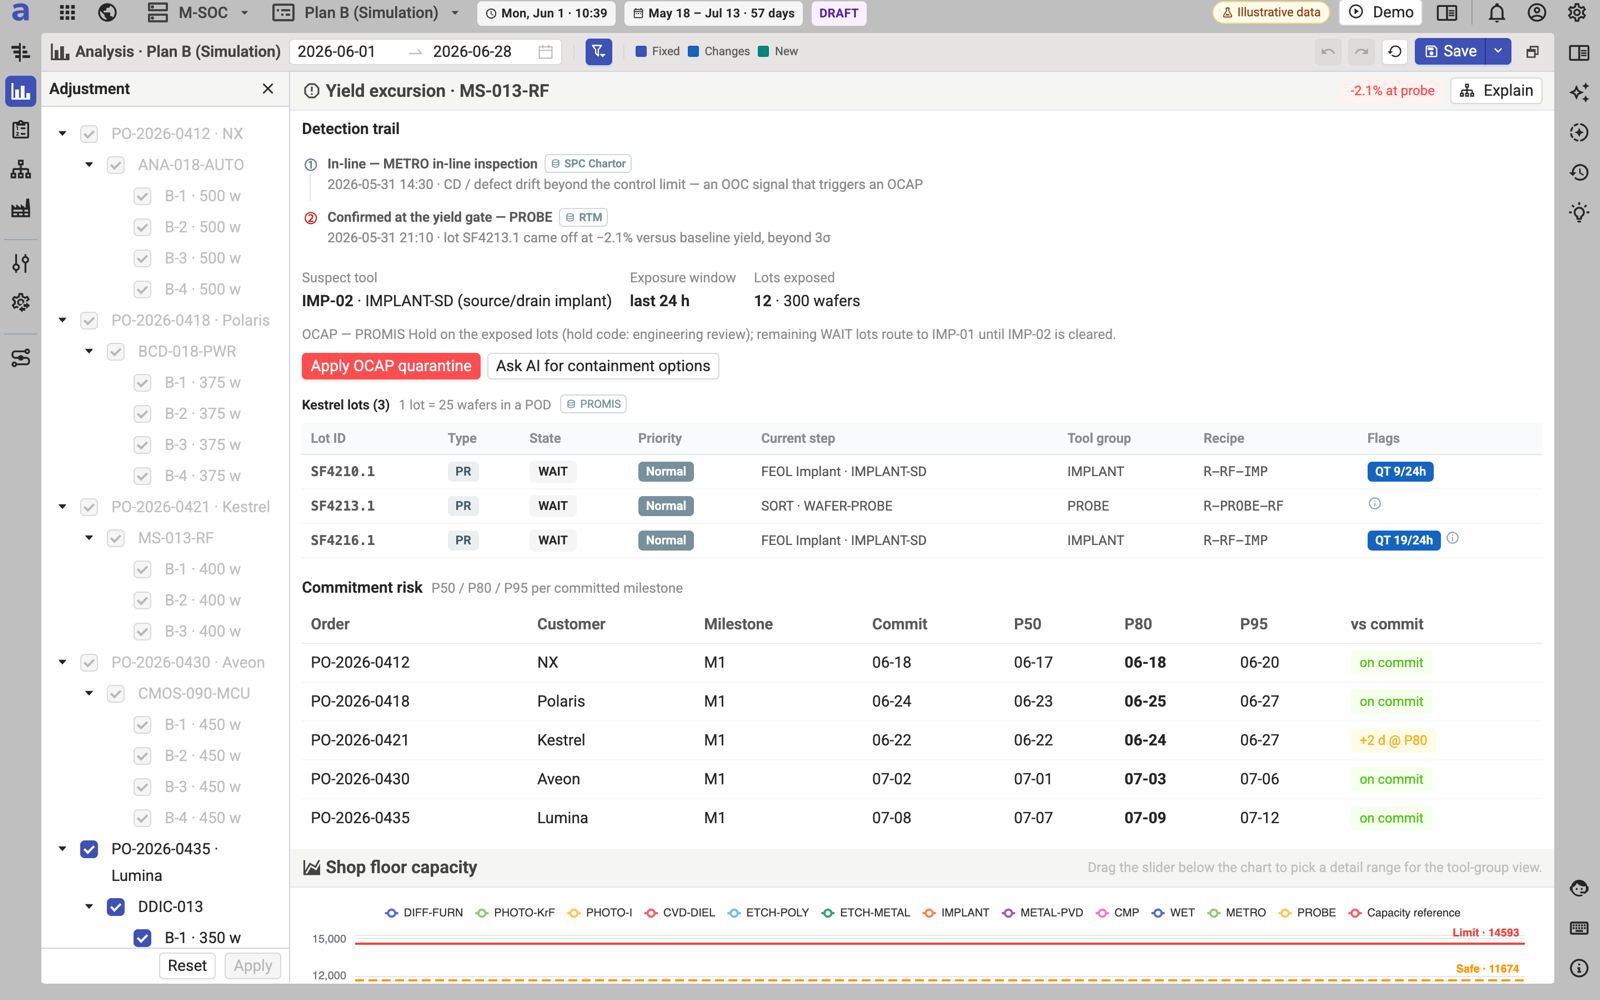
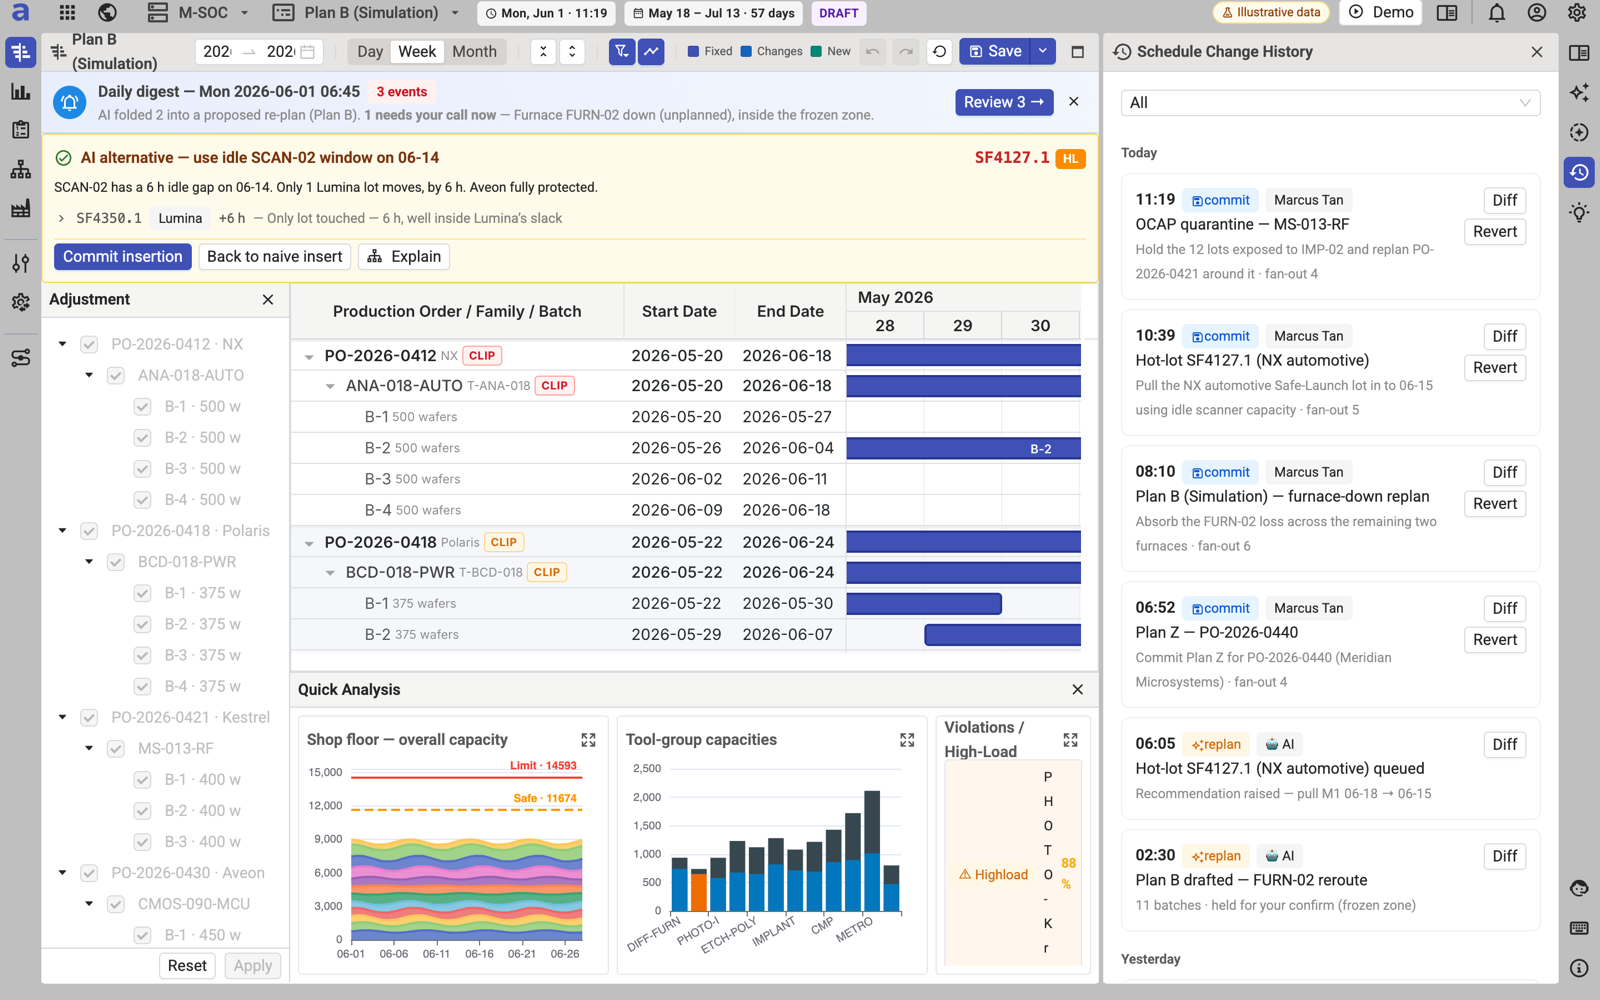
October 2026 MVP build on a synthetic fab dataset: shop-floor capacity by tool group, a yield-excursion drill-down with commitment risk, and the change history behind every commit.
Capabilities
Analytics that serve governance, not just the planner — every decision explainable, every stakeholder notified, every change logged.
Planner and executive views
The planner sees the Gantt, digest and recommendations; the operations manager sees totals, adherence and commitment risk — same data, same minute.
Live KPI row
Yield delta, commitment risk count, bottleneck shift and tool-group load bands update with every plan version.
Drill-down to the lot
From a yield excursion to the 12 affected lots, the suspect tool and the detection trail in two clicks.
Anomaly detection and tune detector
SPC-driven signals flag when a tool runs faster or slower than its spec — with the evidence package for process engineering.
Change history and audit trail
Every commit is immutable and carries the triggering event, the planner’s stated reason and who was notified.
Korean / English
Planner workspace, reports and approval workflow in Korean and English; Korean UI in progress for the December 2026 build.
KPI framework
| Category | KPIs tracked |
|---|---|
| Plan | Schedule adherence, plan stability (changes per day), time-to-commit |
| Delivery | On-time delivery, commitment risk at P50 / P80 / P95, hot-lot lead time |
| Capacity | Tool-group utilization, bottleneck shift, high-load violations |
| Yield | Yield delta per product, excursion exposure, good-die output vs. plan |
| WIP | WIP by stage, held lots, cycle-time distribution |
| Governance | Approvals, overrides in frozen zone, recommendation acceptance rate |
See your own KPIs live in the 2027 pilot
The pilot connects read-only to your MES, ERP and yield data — your numbers, your line, your planners.